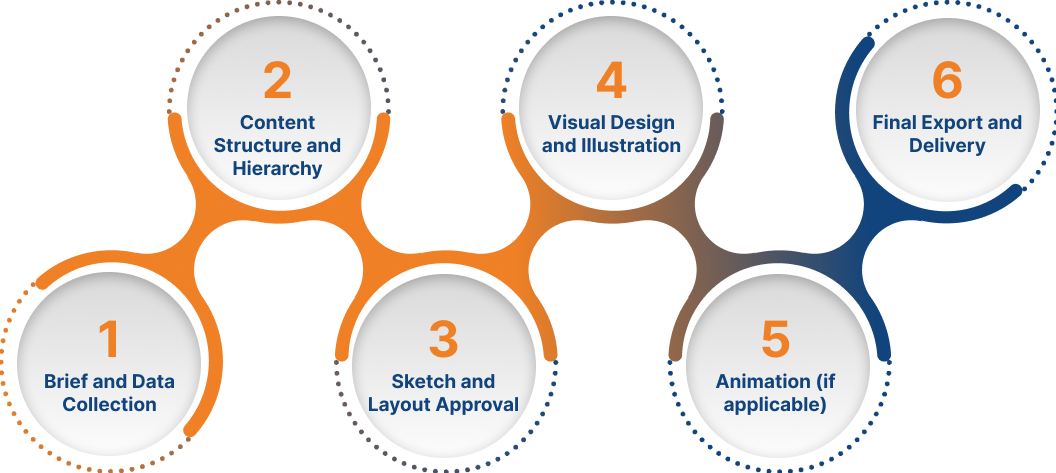
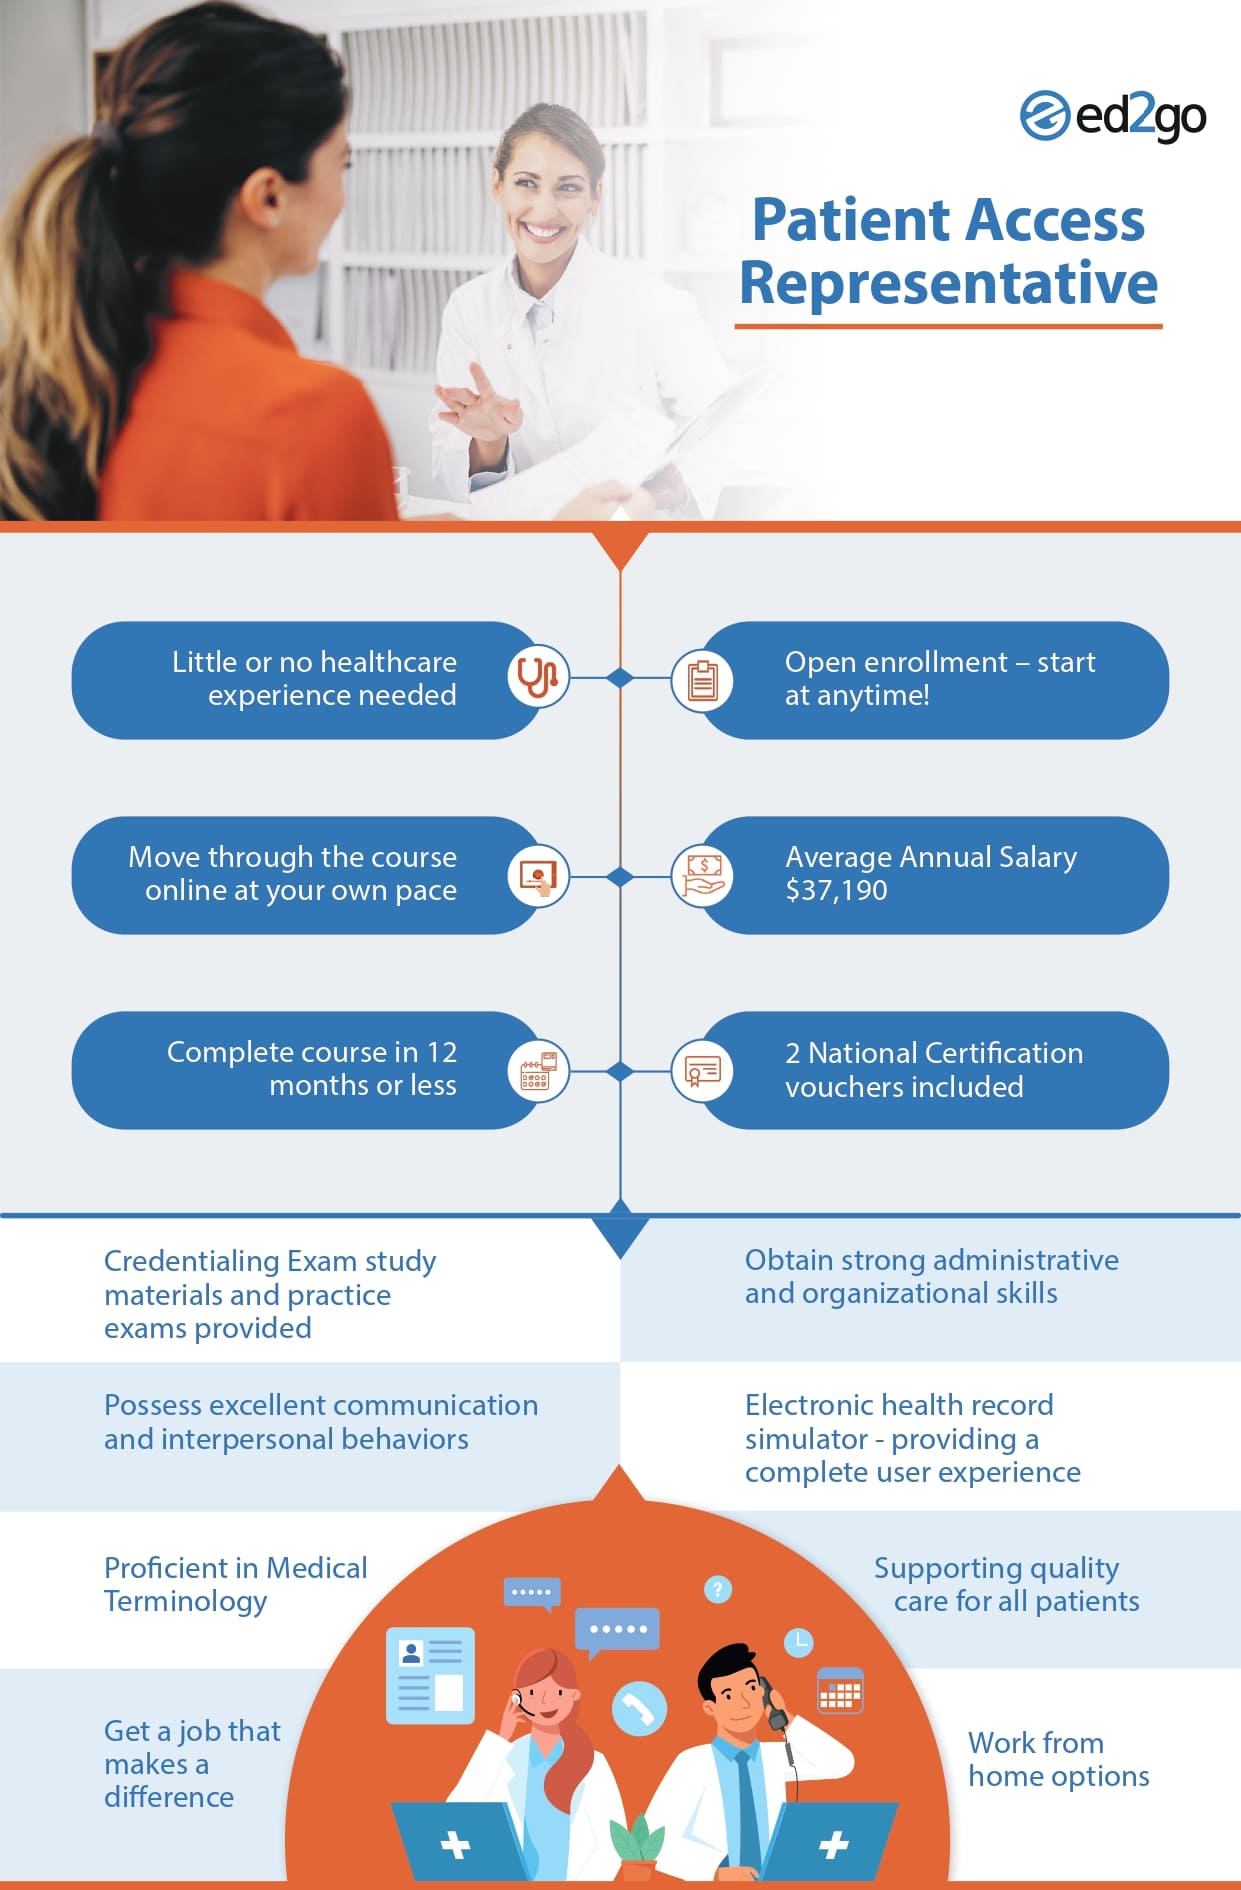
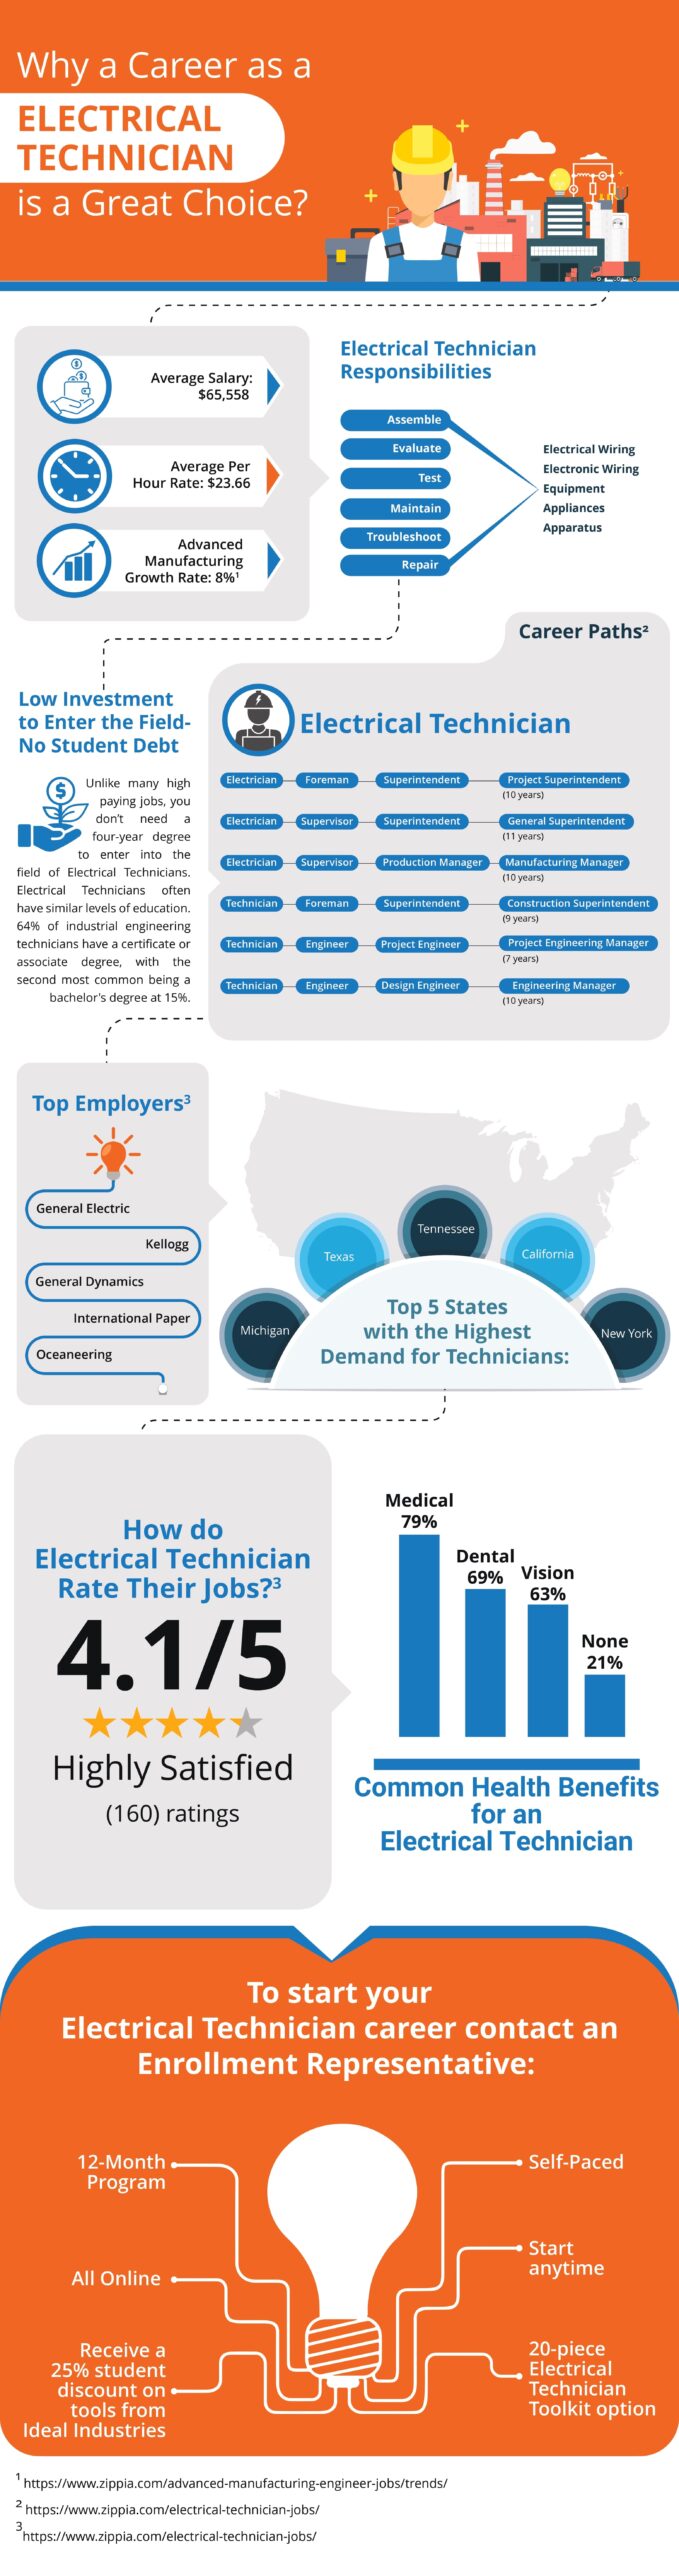
A well-designed infographic communicates in seconds what a paragraph of text takes minutes to convey. At DConstellations, our infographics team transforms complex data, processes, statistics, and learning content into visually compelling, easy-to-understand graphics that drive engagement and retention. We produce static infographics for reports, e-learning modules, and social media, as well as animated infographics and interactive data visualisations for digital platforms and corporate presentations. Every infographic is custom-designed from scratch by our BFA and MFA-qualified visual designers, ensuring each piece is not only informative but visually distinctive and fully aligned to your brand identity. From process flow diagrams and timeline infographics to statistical data visualisations and comparison charts, we handle the full spectrum of informational design needs across E-Learning, corporate communications, and digital marketing.